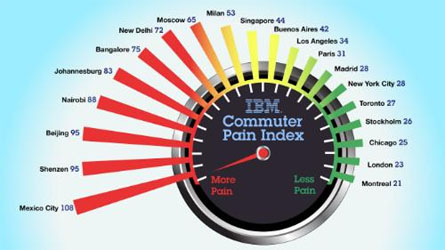
Trends from IBM Global Commuter Pain Survey
A new IBM survey of the daily commute in a cross-section of some of the most economically important international cities reveals a startling dichotomy: while the commute has become a lot more bearable over the past year, drivers’ complaints are going through the roof.
The annual global Commuter Pain survey, which IBM released today (Sept. 8), reveals that in a number of cities more people are taking public transportation rather than driving, when compared with last year’s survey.
In many cities, there were big jumps in the percentage of respondents who said that roadway traffic has improved either “somewhat” or “substantially” in the past three years.
[ Also Read: Survey Shows Commute Can Cause Work Sickness ]But that’s only part of the story. In many cities, the survey recorded significant increases, when compared with last year, in the number of respondents who said that roadway traffic has increased their levels of personal stress and anger and negatively affected their performance at work or school.
“Commuting doesn’t occur in a vacuum,” said Naveen Lamba, IBM’s global intelligent transportation expert. “A person’s emotional response to the daily commute is colored by many factors – pertaining both to traffic congestion as well as to other, unrelated, issues. This year’s Global Commuter Pain survey indicates that drivers in cities around the world are much more unsettled and anxious compared with 2010.”
[ Also Read: Transport Simulator Cities in Motion Released ]Survey Snapshot: Interesting Trends
Fourteen of the 15 cities surveyed in both 2010 and 2011 reported year-over-year increases in respondents who said that traffic had improved either “somewhat” or “substantially” over the past three years, with many of the cities posting substantial increases. For example, New York (24% in 2011 vs. 12% in 2010), Toronto (23% in 2011 vs. 8% in 2010), Milan (27% in 2011 vs. 7% in 2010), Stockholm (42% in 2011 vs. 18% in 2010), Moscow (31% in 2011 vs. 16%), and Johannesburg (29% in 2011 vs. 13% in 2010).
Despite improving traffic conditions, 12 of the 15 cities surveyed in both 2010 and 2011 reported year-over-year increases in respondents who said that roadway traffic has increased their stress levels, with several cities posting substantial increases. For example, New York (45% in 2011 vs. 13% in 2010), Los Angeles (44% in 2011 vs. 21% in 2010), Toronto (40% in 2011 vs. 14% in 2010), London (33% in 2011 vs. 19% in 2010), Milan (61% in 2011 vs. 38% in 2010), and Johannesburg (52% in 2011 vs. 30% in 2010).
[ Also Read: 5 Trends to Change Our Lives in the Next 5 Years ]Eleven of the 15 cities surveyed in both 2010 and 2011 reporter year-over-year increases in respondents who said that roadway traffic has made them angry, with several cities posting substantial increases. For example, New York (35% in 2011 vs. 14% in 2010), Los Angeles, (29% in 2011 vs. 14% in 2010), and Toronto (29% in 2011 vs. 14% in 2010).
Eleven of the 15 cities surveyed in both 2010 and 2011 reported year-over-year increases in respondents who said that traffic has negatively affected their performance at work or school, with several cities posting substantial increases. For example, New York (28% in 2011 vs. 8% in 2010), Toronto (29% in 2011 vs. 17% in 2010), Madrid (30% in 2011 vs. 21% in 2010), Paris (35% in 2011 vs. 26% in 2010), Milan (40% in 2011 vs. 21% in 2010), Stockholm (25% in 2011 vs. 14% in 2010), and Moscow (34% in 2011 vs. 25% in 2010).
When asked about the longest amount of time they have been stuck in traffic over the past three years, the mean time reported by drivers in Mexico City, Moscow, Beijing, Shenzhen and Nairobi were notable, with delays of about two hours.
In Moscow, approximately three in ten drivers (29 percent) say they have been stuck for over three hours. By comparison, about half of the drivers surveyed in Stockholm, Singapore, Madrid and Buenos Aires reported spending less than 30 minutes or literally no time stuck in traffic.
The percentage of New York metro area drivers who are driving to work or school alone decreased to 59 percent in 2011 vs. 90 percent last year.
If traffic didn’t take up so much time, commuters would rather devote it to personal relationships and improving their physical health. More than half of respondents (56 percent) would spend time won back with family/friends; while nearly half (48 percent) would exercise and 40 percent would spend more time on recreation. Nearly three in ten drivers (29 percent) would sleep more.
Commuters in Nairobi seem to take traffic in stride despite the fact that they average among the longest commutes. Nearly half (48 percent) report that roadway traffic has not impacted their health.
On average, drivers in Nairobi, Mexico City, Johannesburg, Beijing, Bangalore, and Moscow spend the longest amount of time (36 minutes or more) on the road to get to their workplace or school.
This is IBM’s fourth annual Commuter Pain survey in which 8,042 commuters in 20 cities on six continents were surveyed.
💛 Support Independent Journalism
If you find RMN News useful, please consider supporting us.


