2017 Among the 3 Warmest Years on Record: WMO

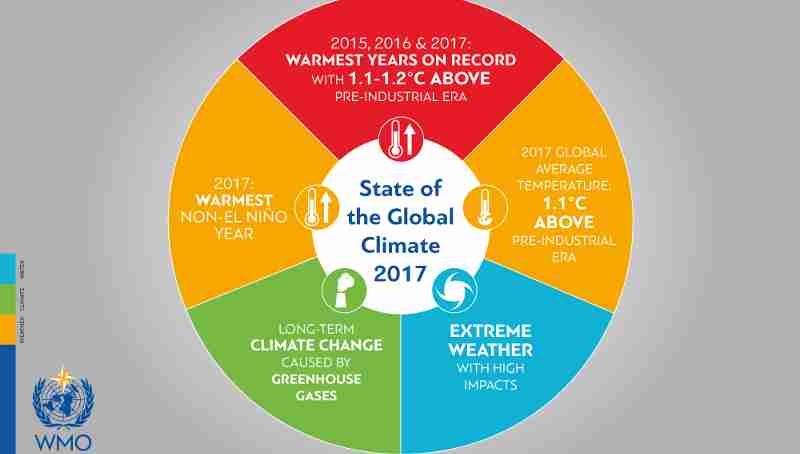
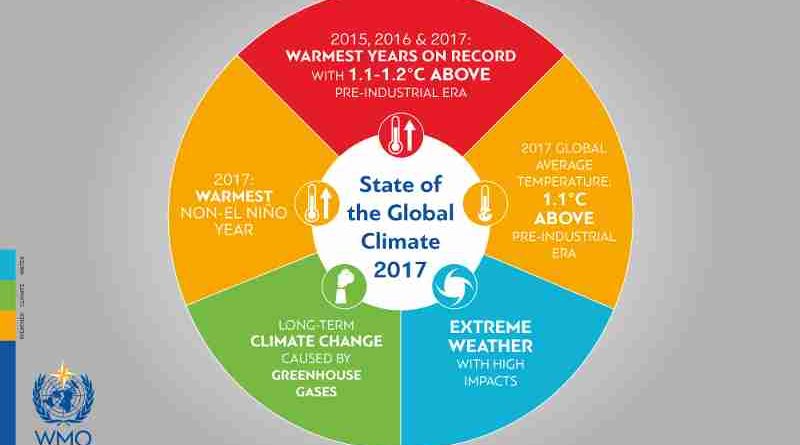
The World Meteorological Organization (WMO) confirmed Thursday that 2017 was among the three warmest years on record. In a clear sign of continuing long-term climate change caused by increasing atmospheric concentrations of greenhouse gases, 2015, 2016 and 2017 have been confirmed as the three warmest years.
According to WMO, 2016 still holds the global record, whilst 2017 was the warmest year without an El Niño, which can boost global annual temperatures.
A consolidated analysis by WMO of five leading international datasets showed that the global average surface temperature in 2017 was approximately 1.1° Celsius above the pre-industrial era.
The year 2016 remains the warmest year on record (1.2°C above preindustrial era). Global average temperatures in 2017 and 2015 were both 1.1°C above pre-industrial levels. The two years are virtually indistinguishable because the difference is less than one hundredth of a degree, which is less than the statistical margin of error.
“The long-term temperature trend is far more important than the ranking of individual years, and that trend is an upward one,” said WMO Secretary-General Petteri Taalas. “Seventeen of the 18 warmest years on record have all been during this century, and the degree of warming during the past three years has been exceptional. Arctic warmth has been especially pronounced and this will have profound and long-lasting repercussions on sea levels, and on weather patterns in other parts of the world.”
The globally averaged temperature in 2017 was about 0.46°C above the 1981-2010 long-term average (14.3°C). This 30-year baseline is used by national meteorological and hydrological services to assess the averages and variability of key climate parameters, such as temperature, precipitation and wind, which are important for climate sensitive sectors such as water management, energy, agriculture and health.
In addition to the global warming due to rising greenhouse gas levels in the atmosphere, the climate also has a naturally occurring variability due to phenomena such as El Niño, which has a warming influence, and La Niña, which has a cooling influence. The strong 2015/2016 El Niño contributed to the record temperature in 2016. By contrast, 2017 started with a very weak La Niña and also finished with a weak La Niña.
“Temperatures tell only a small part of the story. The warmth in 2017 was accompanied by extreme weather in many countries around the world. The United States of America had its most expensive year ever in terms of weather and climate disasters, whilst other countries saw their development slowed or reversed by tropical cyclones, floods and drought,” said Mr Taalas.
WMO will issue its full Statement on the State of the Climate in 2017 in March. This report will provide a comprehensive overview of temperature variability and trends, high-impact events, and long-term indicators of climate change such as increasing carbon dioxide concentrations, Arctic and Antarctic sea ice, sea level rise and ocean acidification.
WMO uses datasets (based on monthly climatological data from observing sites) from the United States National Oceanic and Atmospheric Administration, NASA’s Goddard Institute for Space Studies, and the United Kingdom’s Met Office Hadley Centre and the University of East Anglia’s Climatic Research Unit in the United Kingdom.
It also uses reanalysis datasets from the European Centre for Medium Range Weather Forecasts and its Copernicus Climate Change Service, and the Japan Meteorological Agency.
This method combines millions of meteorological and marine observations, including from satellites, with models to produce a complete reanalysis of the atmosphere.
The combination of observations with models makes it possible to estimate temperatures at any time and in any place across the globe, even in data-sparse areas such as the polar regions.
The World Meteorological Organization is the United Nations System’s authoritative voice on Weather, Climate and Water.


