IBM Offers New Flood Prediction Technology
Researchers from IBM and the University of Texas at Austin have applied advanced analytics to river systems, weather and sensor data, to predict the Guadalupe River’s behavior more than a hundred times the normal speed.
Simulating thousands of branches at a time, this technology could help provide up to several days warning of a flood, allowing more time for disaster prevention and preparedness.
Floods are the most common natural disaster in the United States, but traditionally flood prediction methods are focused only on the main stems of the largest rivers – overlooking extensive tributary networks where flooding actually starts, and where flash floods threaten lives and property, believes IBM.
It says its new flood prediction technology can simulate tens of thousands of river branches at a time and could scale further to predict the behavior of millions of branches simultaneously.
By coupling analytics software with advanced weather simulation models, such as IBM’s Deep Thunder, municipalities and disaster response teams could make emergency plans and pinpoint potential flood areas on a river.
“Effective flood preparedness can be looked at as a large scale computing problem, with a huge number of relevant data and independencies,” said Frank Liu, research staff member at IBM Research – Austin.
“Using advanced models to simulate the scores of tributaries of large rivers along with other relevant real-time information such as weather, we are better able to give people valuable advance notice of a flood.”
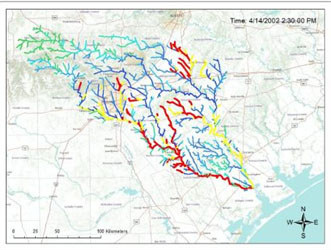
As a testing ground, the team is presently applying the model to predict the entire 230 mile-long Guadalupe River and over 9,000 miles of tributaries in Texas. In a single hour the system can currently generate up to 100 hours of river behavior.
In addition to flood prediction, a similar system could be used for irrigation management, helping to create equitable irrigation plans and ensure compliance with habitat conservation efforts. The models could allow managers to evaluate multiple “what if” scenarios to create better plans for handling both droughts and water surplus.
In the picture above: The colored lines indicate a rain storm and the increasing depth of the rivers. The highlighted sections show areas with the highest potential for flooding.


